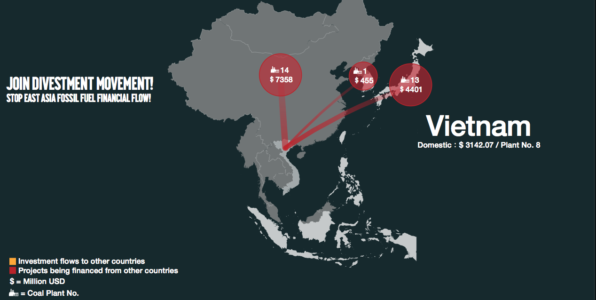
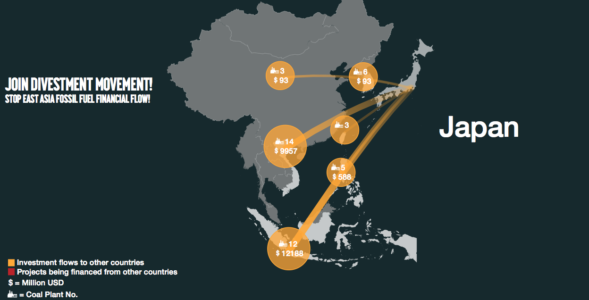
Q: What do the dots, lines, and numbers in red and yellow mean in the East Asian map?
A: 

The dots locate the country. The width of lines means financial flows between countries. The numbers in the dots mean “financed coal plants numbers” and “total investment amount (million USD).”
Color red means the “projects being financed from other countries,” for example, 13 Vietnamese coal plants are financed by Japanese financial institutions, with total amount 4401 million USD.
Color yellow means “Investment flows to other countries,” for example, Japanese financial institutions are investing 14 coal plant in Vietnam with total amount 9957 million USD.
Q: Can you explain the difference between “units” and “plants”?
A:
The website provides separate data on each of the multiple facilities that typically exist at a particular location. Each of these facilities is referred to as a “unit.” The entire collection of units at a given location is referred to as a “plant.”
Q: How do you calculate the total coal plant numbers and investing amount?
A: We locate “plant” on the map and summed up the investment amount of “plant” (entire collection of units).
Q: What do “status” category mean in the coal plant profile?
A: 
“Operating” means the plant is in commission.
“Construction” means the plant is constructing.
“pre” means the plant is planning with unidentified investor and unidentified investment amount.
“pre: I” means the plant is planning with identified investor but unidentified investment amount.
“pre: A” means the plant is planning with identified investment amount but the unidentified investor.
“pre: I, A” means the plant is planning with identified investor and investment amount.
“shelved” means progress of the coal plant has been halted for at least two years.
“canceled” means a cancellation announcement has been made, or no progress has been observed for at least four years.
“retired” means the plant is decommissioned.
Q: How do you define “Capacity”?
A:
Capacity is measured in gross megawatts, prior to subtracting capacity used for plant operations.
Q: How does the financial institution invest in fossil fuel industries?
A: Financial institutions invested by numbers of ways including but not limited to loans, underwriting, bonds holding, shareholding or any other unidentified investment means.
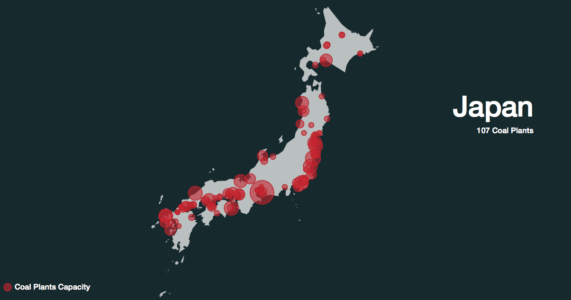
Q: In each region’s map, what does the red dot mean? Does the size of red dots matter?
A:
The red dots mean the coal plant. The sizes of red dots show the capacity. We mapped the approximate location of the whole coal plant in each region.
Q: Some of the coal plants (red dots) in the regional map are overlapping, Where could I refer to the whole project?
A: You can click the each region’s financial data sub-page on the navigation bar, you will find the whole plant list in the data page. We only show coal plant, rather unit.
Q: Is the location of each plant correct?
A: The coal plant mapping in each region’s page is the approximate location information (longitude, latitude) that could be found by partners.
Q: If I would like to see or share more fossil fuel struggle stories, where could I make the contribution?
A: We only show 3 latest stories on the regional page. More stories could be found in Latest Stories on the “Home” page. If you are interested in sharing your precious stories or news, please fill in your information here, and check detailed instruction in “Fossil Fuel Struggle Story.”
Q: What if I find an error or a missing project?
A: Please send information on errors or omissions to us.
Q: Who built this website?
A: Please refer to “Disclaimer & Acknowledgement” page.
